Individual
The individual view provides a decision plot based on Shapley Values. The decision plot’s straight vertical line marked at the x-axis 500-value marks the model’s base value. Starting at the bottom of the plot, the prediction line shows how the Shapley value accumulates from the base value to arrive at the model’s final score at the top of the plot. Hovering over each dot on the line shows the variable name, variable value, evispot score and target of the data point.
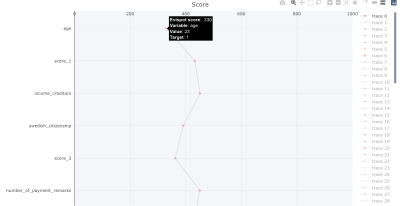
X-axis: Model score which can be between 0 – 1000, 0 is equal to high risk while 1000 is equal to low risk.
Y-axis: The variables included in a decision, ordered so the variable which has most global impact will be listed at the top. The variable with least global impact listed at the bottom.
A user can set filter(s) and the decision plot will only show data points that fulfill the given filters.
We exist to ensure that decisions are given in an accurate, transparent, ethical & fair manner.
