Visualize data
Visualization of the data is shown in the preprocessing section which contains three different views.
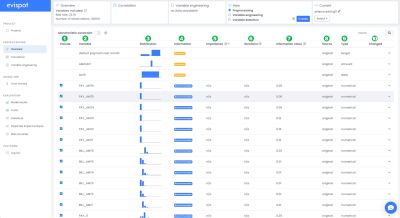
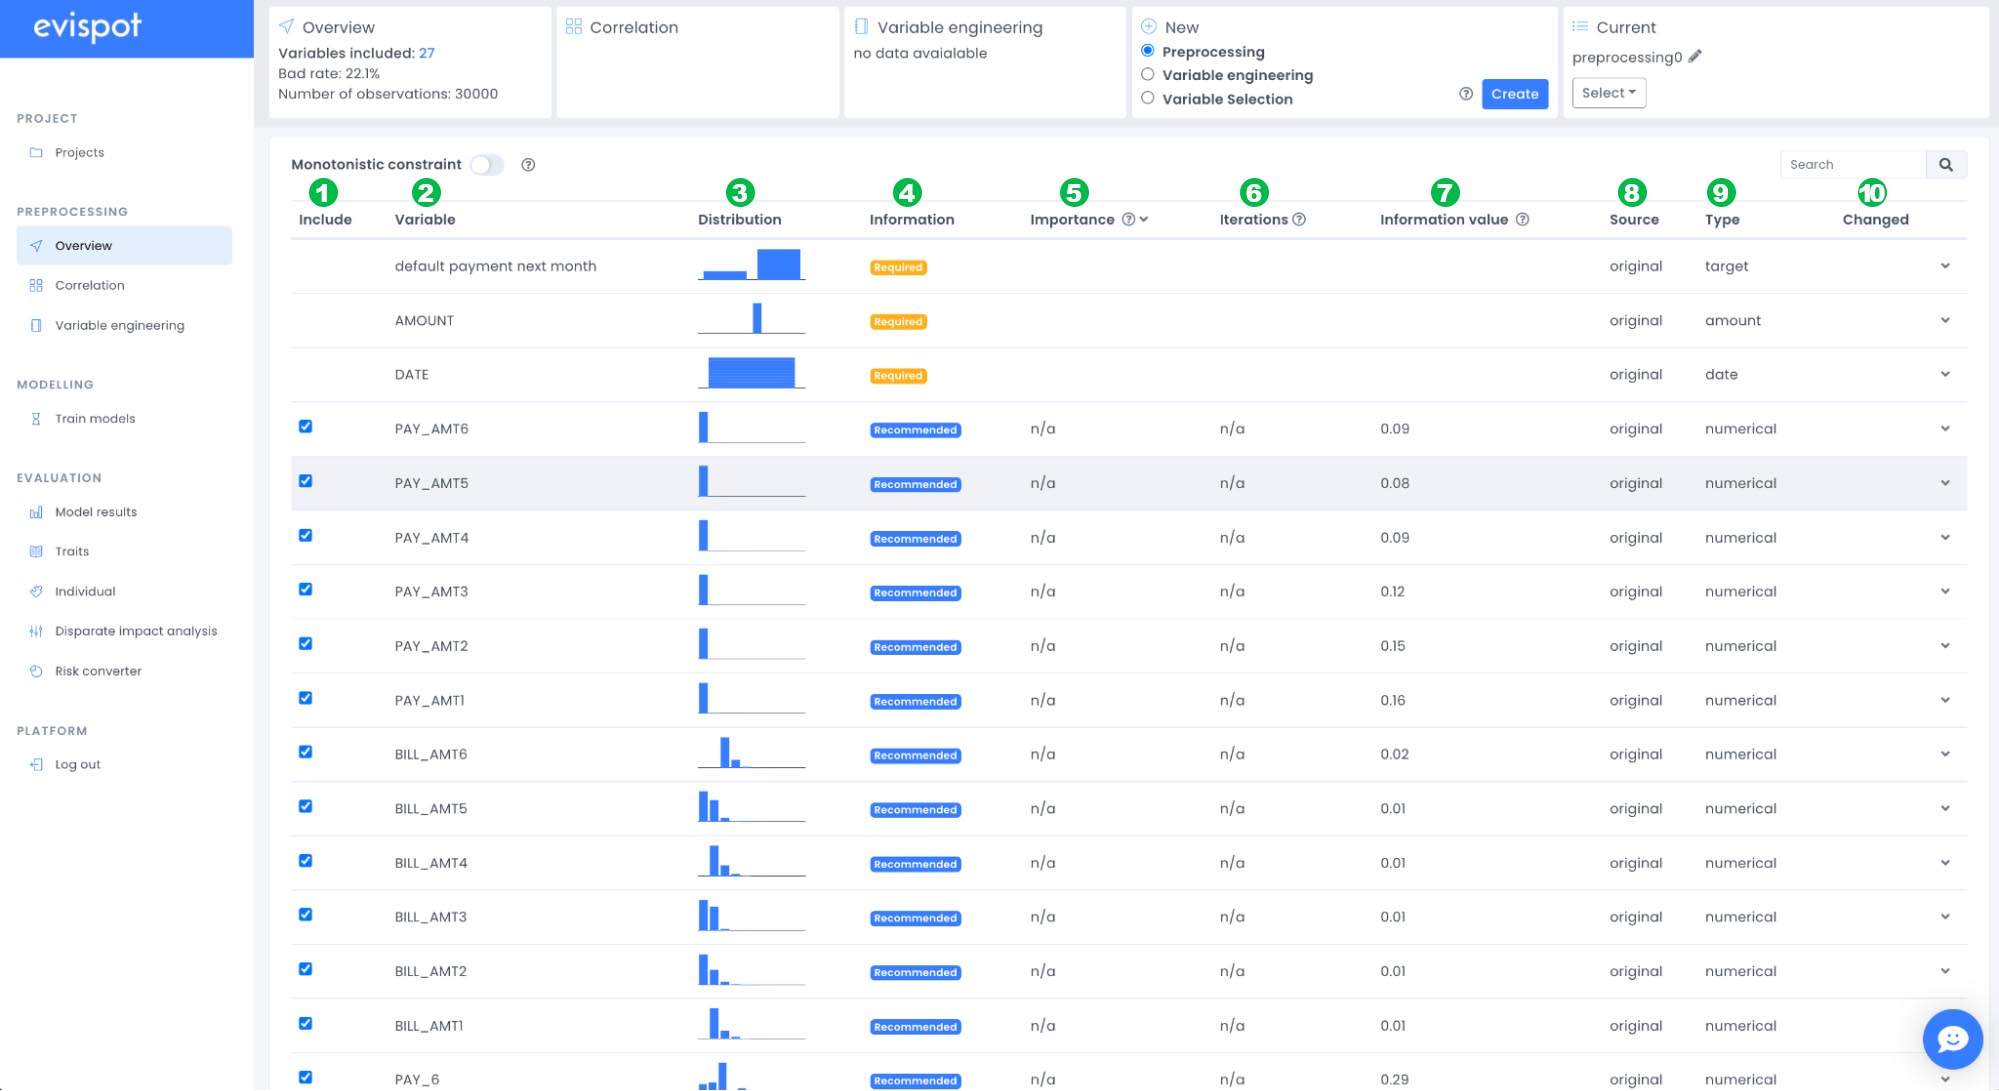
1: Overview: Including general information about the dataset such as number of rows, number of variables, number of bad and good. In our case we can see that the dataset consists of 27 variables, 30 000 loan applications and a default rate of ~22%. A table is shown that displays detailed information about each variable in a table.
2: Correlation: Including the necessary tools to understand correlation between variables such as correlation matrix and correlation plots. (not included in this tutorial)
3: Variable engineering: Including detailed information if a variable engineering has been performed (not included in this tutorial)
The table that is shown above includes the following information about each variable.
1: Include: If this variable will be used in the model training
2: Variable: The variable name
3: Distribution: A variable distribution plot
4: Information: Required consists of application date, amount and target variable. These variables are not included in the model training. If a variable is recommended it has predictive power and the recommendation is to include it in model training unless some conditions, see tips further down.
5: Importance: The importance of a variable, an engineering/selection must be performed to see a value here (not included in this tutorial)
6: Iteration: The number of models training a variable has been predictive on, an engineering/selection must be performed to see a value here (not included in this tutorial)
7: Information value: The predictive power of each variable.
8: Source: If it is an original variable that was uploaded or an engineered variable.
9: Type: Four variable types exist in the platform: numerical, categorical, WOE encoded and undefined variables. Undefined variables are variables that have more than 50 unique values and contain non-numbers, e.g text/strings. These variables will not be used in model training
10: Changed: If you ignore a variable, set a constraint or change type, icons will show up to give you an overview if something has changed from the recommendations.
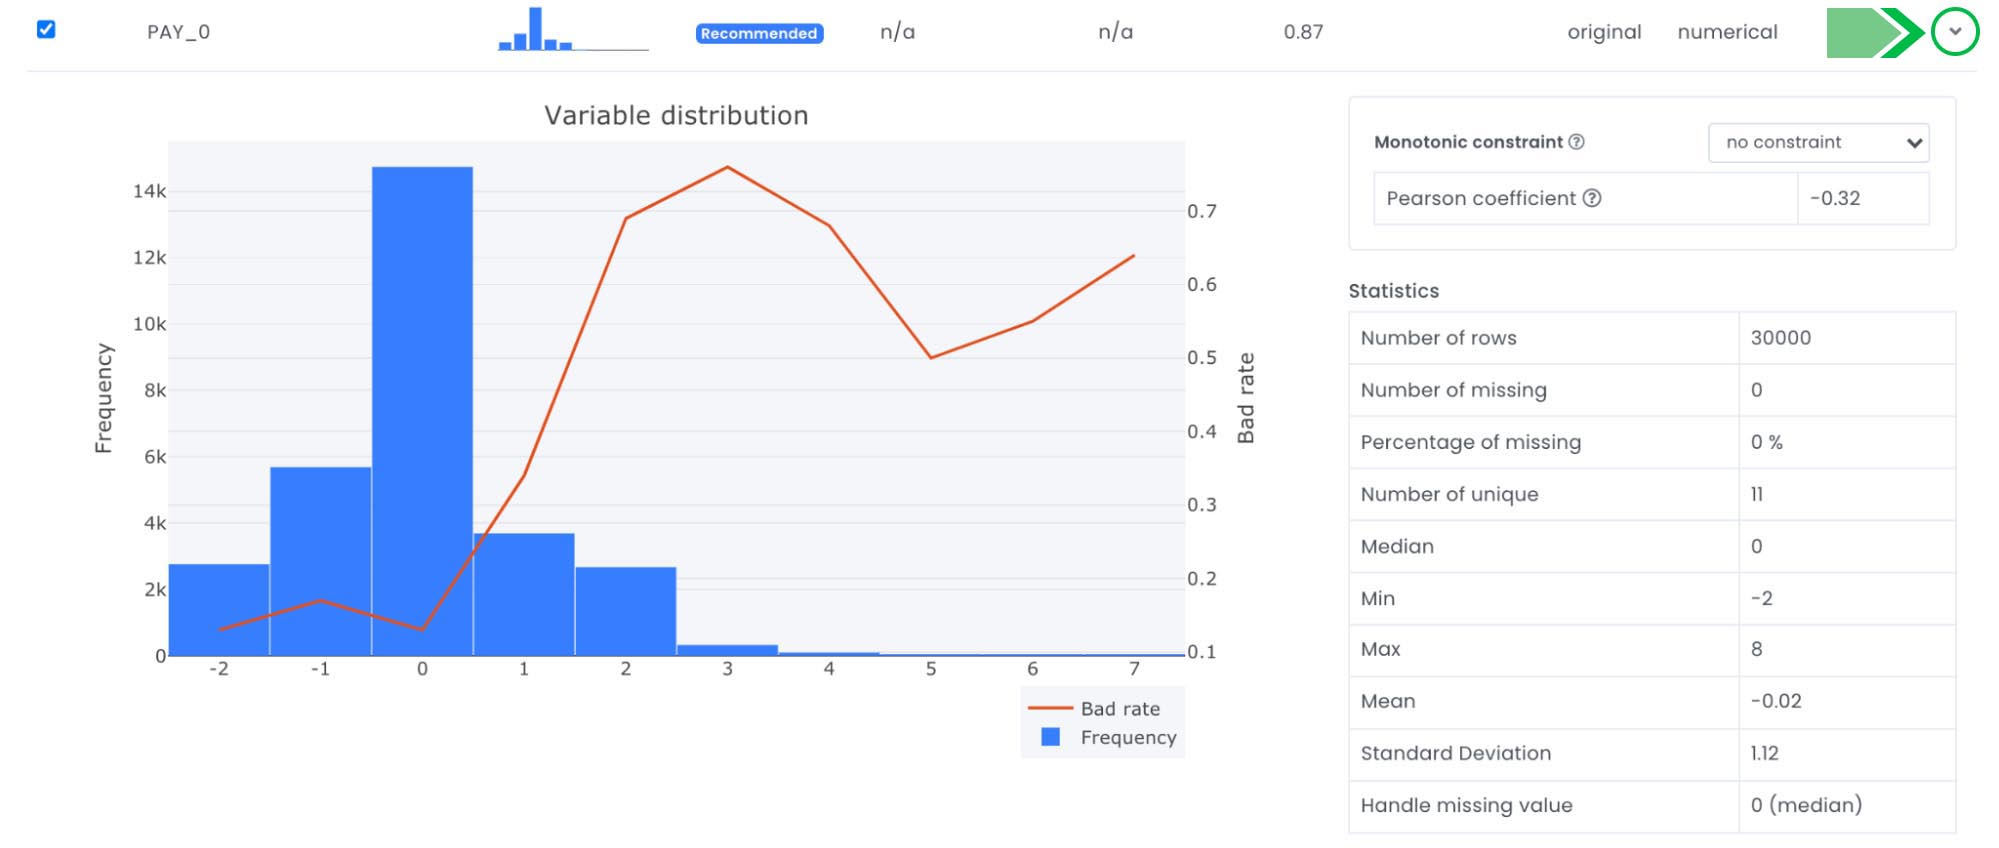
You can also expand a variable to see more detailed statistics about each variable such as, number of missing, number of unique values min, max and more.

Tips
The goal with the preprocessing section is to choose the variables we want for our model training. In the overview page we can ignore variables that we don’t want to include in our model training.
Examples of variables we don’t want are ID variables, such as customerID or variables with very high information value, since this could be target leakage. In lending one target leakage example would be the interest rate, since we will not know the interest rate before we try to predict the risk of a loan applicant.
Evispot ML platform helps you to identify potential target leakage, by sorting on column “information value” we will see the predictive power of each variable. If a variable has above 0.5 it means that it has very high predictive power and might be a possible target leakage. In the dataset we are working with we can see that two variables are above 0.5, “PAY_0” and “PAY_2”, in this case we know that these variables are representing the history of past payment.
Since we are predicting if an existing credit card owner will default or not during the next month and we also know that we will always have the last 6 months of data available for a new prediction, we will be able to use this data.
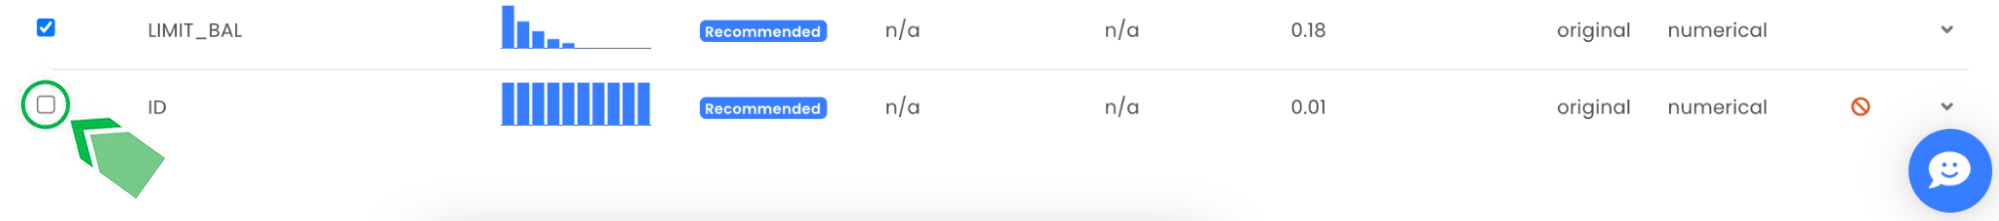
We can see that a variable named ID exists, which we want to ignore. This since it is a number that has been created after a credit card loan has given out and nothing we want to use for model prediction.
After we ignore the ID variable, we will go to the next step: train model (see menu to the right side of the preprocessing table).

We exist to ensure that decisions are given in an accurate, transparent, ethical & fair manner.
