Correlations
The correlation view provides the tools to analyse correlation between variables. A correlation matrix is provided with the possibility to dig deeper into correlation plots between two variables.
Correlation Matrix
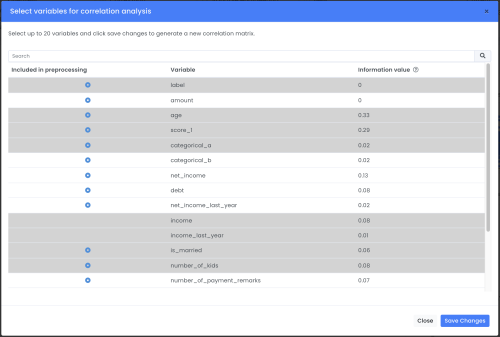
A correlation matrix will automatically be shown using the variables that have been chosen by the user or recommended by the platform. If more than 20 variables have been chosen, the variables with the highest correlation will be selected and shown in the matrix as default.
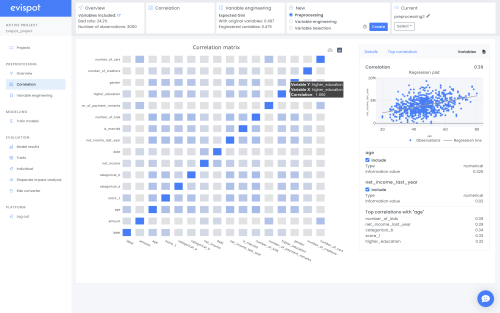
By clicking on the button Variables up to the right corner a user can choose other variables to analyse from a pop-up.
There are different correlation statistics for different variable types. Therefore, to show the correlation between all variables we compute the pairwise correlations between them according to their respective type. Their type is firstly defined by Evispot, but if it’s changed by the user the correlation between that variable and all the rest has to be re-calculated.
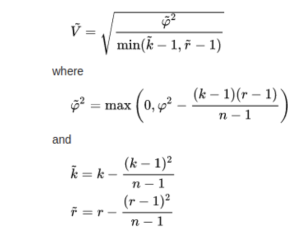
What is happening under the hood
Correlation values are calculated differently depending on a variable’s type, (e.g categorical, or numerical). To show different variable types in one plot, the correlation values are constructed by computing the pairwise correlations between variables according to their respective type. The variable type is automatically determined by the software but can be changed, if changed the correlation between the changed variable and all other variables are recalculated.
For numerical-numerical variable paris, the statistics is calculated using pearson coefficient. To be able to compare this value with categorical variables, the absolute value is used, meaning a value between 0-1 will be shown.
For categorical-categorical variable pairs, Cramer’s V is used which is based on Pearson’s chi-squared statistical test.The exact calculation that is used includes a bias correction (see algebra below)
For numerical-categorical variable pairs, the correlation ratio is used, which is a measure of the relationship between the statistical dispersion within individual categories and the dispersion across the whole population or sample. The measure is defined as the ratio of two standard deviations representing these types of variation.
We exist to ensure that decisions are given in an accurate, transparent, ethical & fair manner.
