Model results
The model results is the first page that opens when navigating to evaluation. This page provides different KPIs both for the test data and the cross-validation together with a score distribution plot and a decision tree surrogate model.
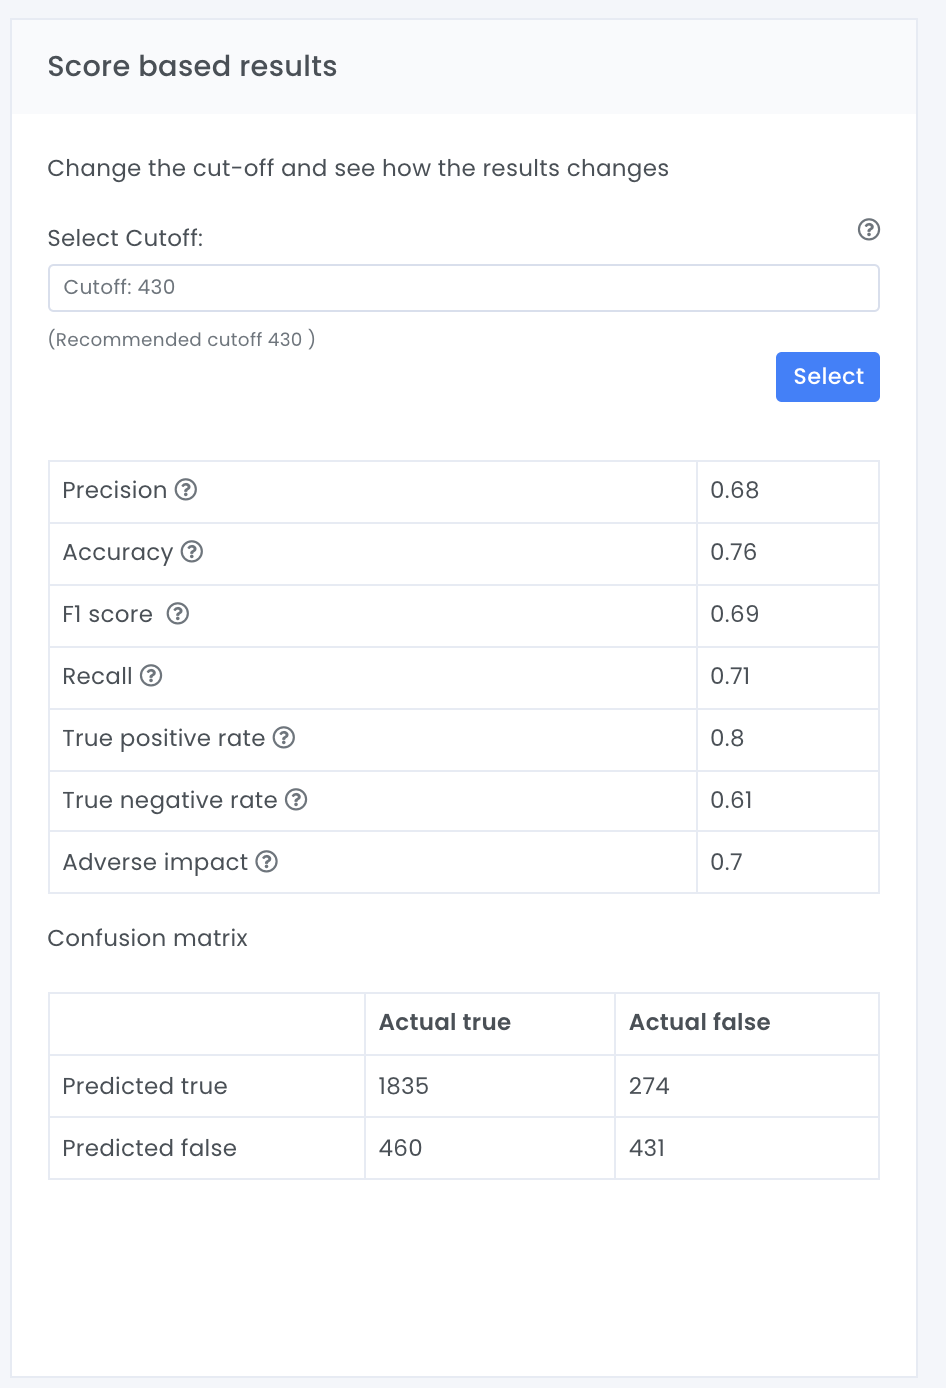
Score based results
Score based results present KPIs from the test data. KPIs that are shown are based on the confusion matrix and include precision, accuracy, F1 score, recall, true positive rate, true negative rate and adverse impact. (see glossary for explanation)
Note The cutoff value must be a value between 0 – 1000, which is the same as the model prediction. As a default value the maximized F1 score is used. If you specify a new cutoff value, Evispot AI platform automatically computes a diagnostic confusion matrix and associated KPIs for that given threshold value.
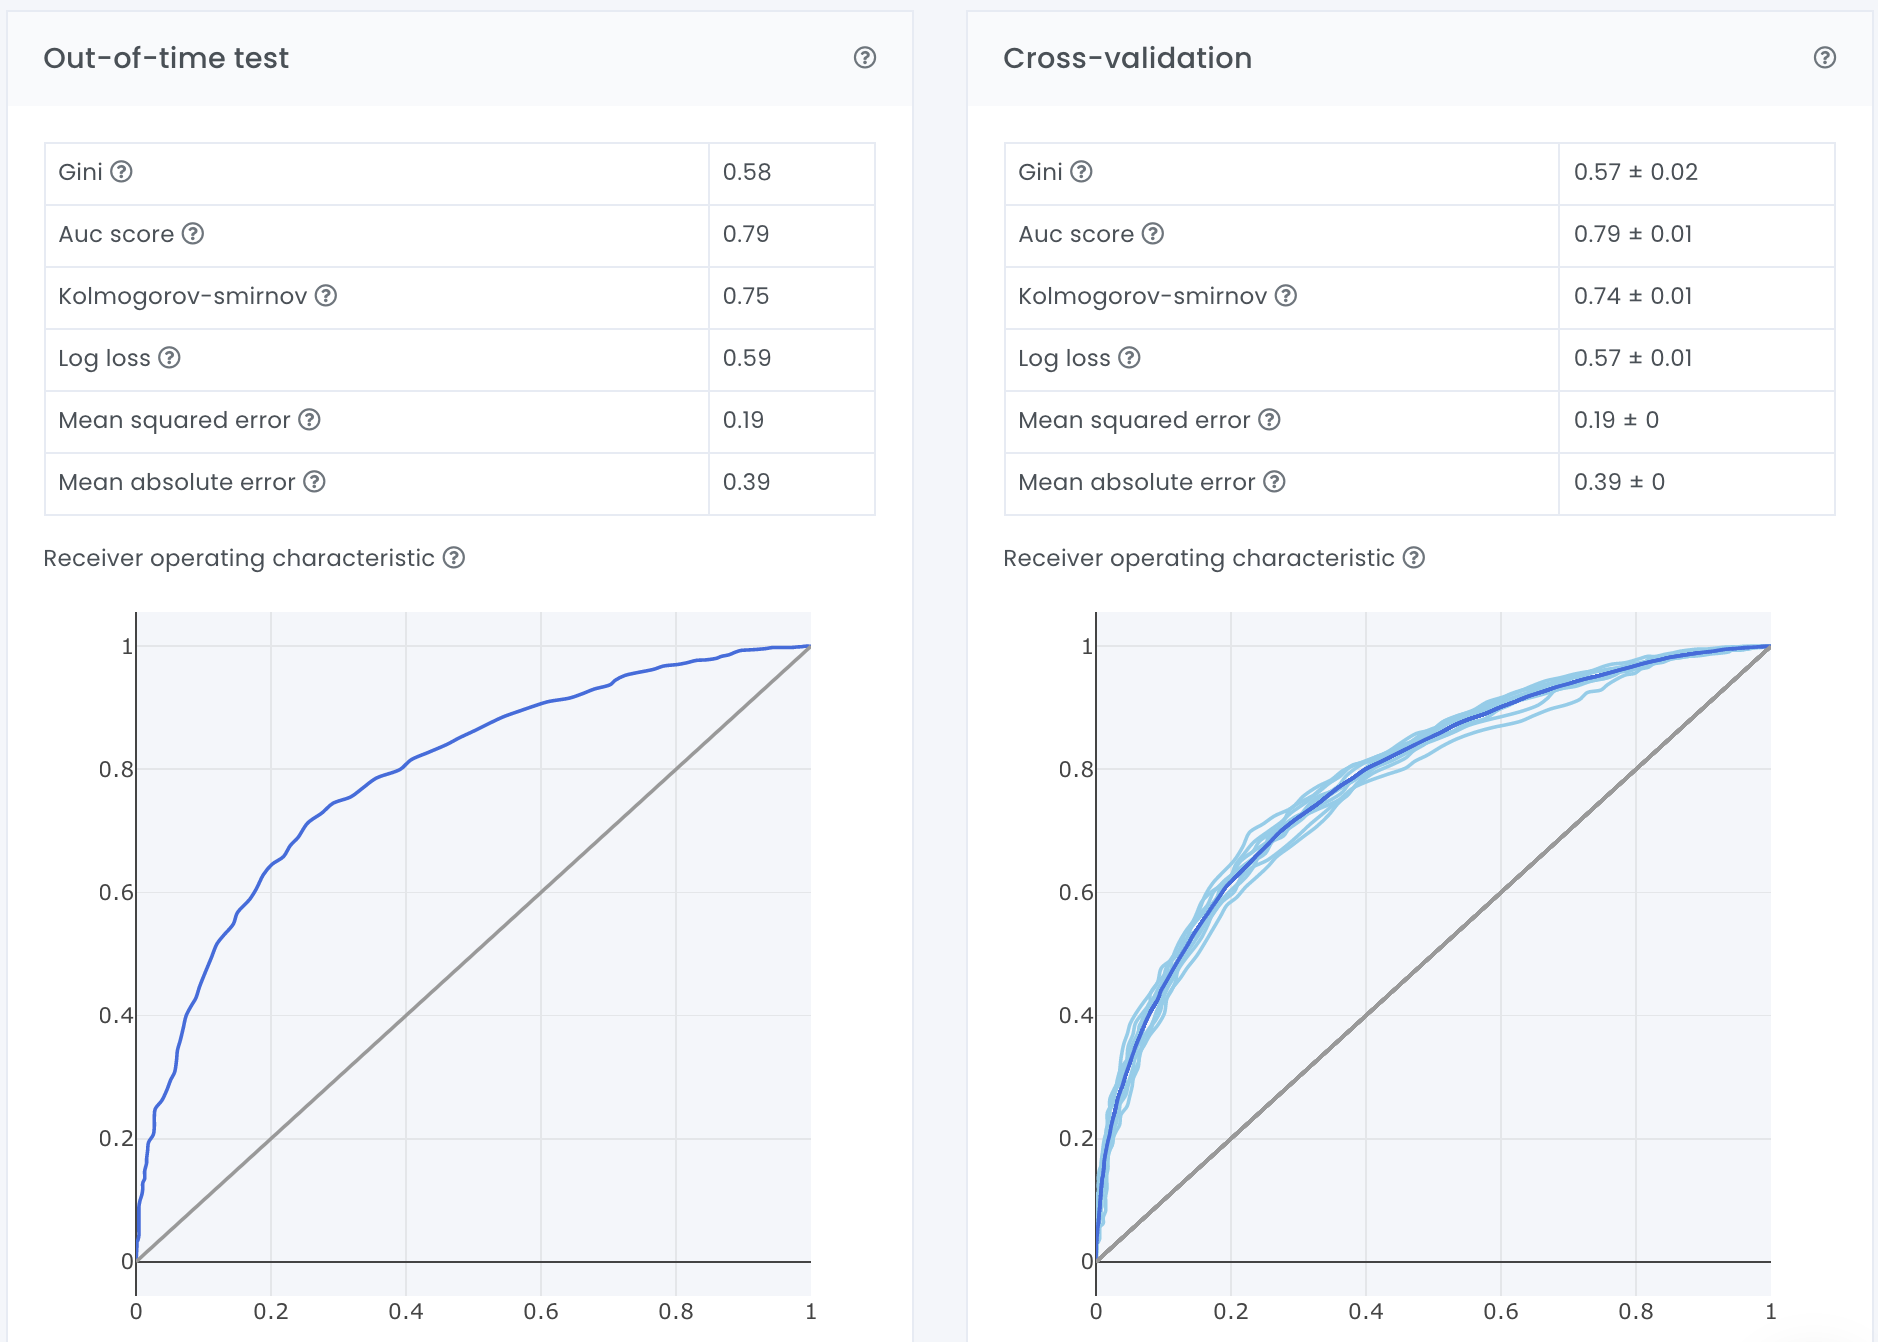
Out-of-time test and Cross-validation
Out-of-time test and cross validation present model KPIs for the test data (out-of-time) or training data (cross-validation). KPIs that are shown are gini, AUC, kolmogorov-smirnov, log loss, mean squared error, mean absolute error and roc curves.
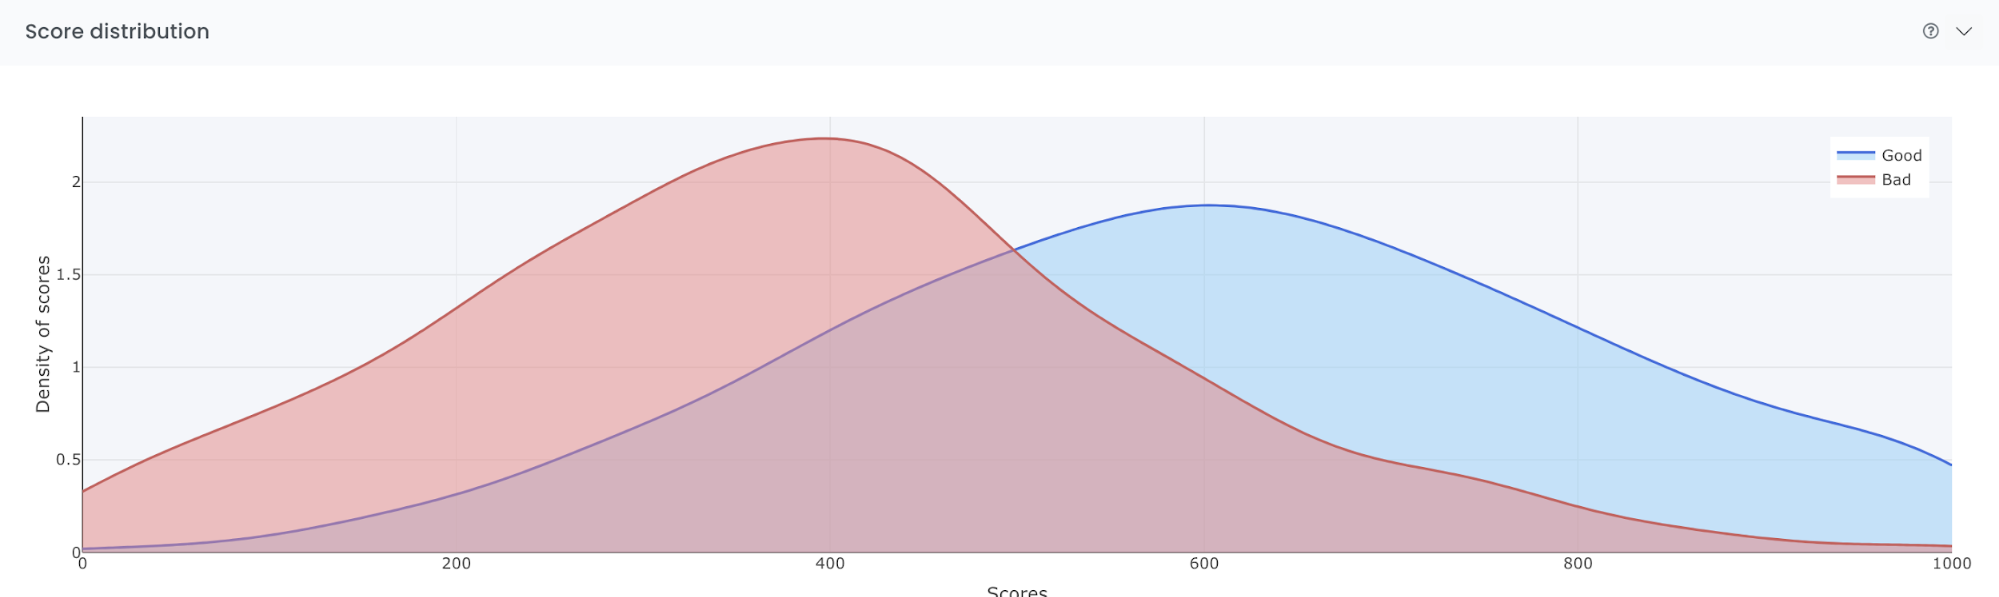
Score distribution
The score distribution plot shows the density of scores splitted by the target classes (good and bad observations). The blue distribution represents the density of the good observations while the red represents the bad observations. The objective with the plot is to visually illustrate the model’s ability to differentiate between good and bad observations.
The x-axis shows the model score, which will be a value between 0 and 1000. The y-axis shows the density of scores. By looking at the plot below it is possible to see that most bad observations are getting a score around 400 and the most good observations are getting a score around 600.
Undersampling allows the distribution to consistently be centered around 500. If no undersampling were used the distribution would be centered far to the left.
Decision tree surrogate
In the Decision Tree plot, the highlighted row shows the path to the highest probability leaf node and indicates the globally important variables and interactions that influence the prediction for that row.
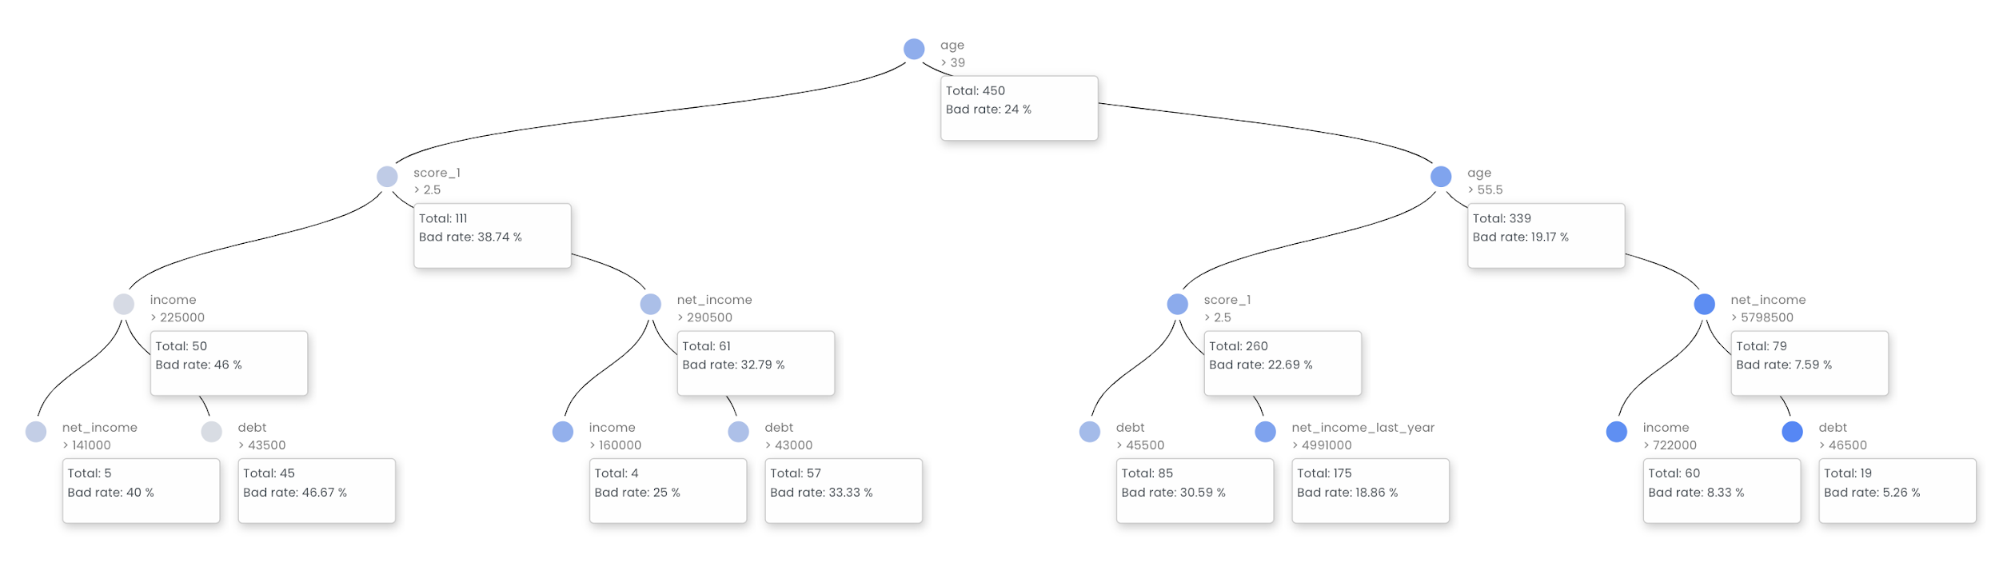
The decision tree surrogate increases the transparency of the AI model by displaying an approximate flow-chart of the complex decision making process. The decision tree surrogate also displays the most important variables in the model and the most important interactions in the model. The decision tree surrogate can be used for visualizing, validating, and debugging the model by comparing the displayed decision-process, important variables, and important interactions to known standards, domain knowledge, and reasonable expectations.
A surrogate model is a data mining technique in which a generally simpler model is used to explain another, usually more complex, model or phenomenon. The decision tree surrogate is known to date back at least to 1996 (Craven and Shavlik). The decision tree surrogate model here is trained to predict the predictions of the more complex Evispot AI model using the original model inputs. The trained surrogate model enables a heuristic understanding (i.e., not a mathematically precise understanding) of the mechanisms of the highly complex and nonlinear Evispot AI model.
R2 value
The R2 value is a number between 0 and 1 illustrating what the actual model predicts and what the surrogate predicts. Where 1 means that the actual model and the surrogate model predicts exactly the same at all times.
We exist to ensure that decisions are given in an accurate, transparent, ethical & fair manner.
