- Home
- Documentation
- Evaluation
- Risk converter
Risk converter
The risk converter view is tailored for credit decision models. The risk converter allows the user to transform the model score to a profit and loss calculation. To calculate a profit and loss calculation a user needs to provide metrics such as costs associated with a loan, interest rates, EAD, LGD and more, choose a target feature, such as ROE, acceptance rate, bad rate and a target value.
Personalize settings
The personalize settings section is where a user can fill in information that is needed to calculate all KPIs. The following metrics can be filled in: Loss given Default (LGD), Exposure of Default (EAD), Capital Cover rate, Additional fees, Financing cost, Marketing cost, Other overhead costs and Interest rate for different model score intervals
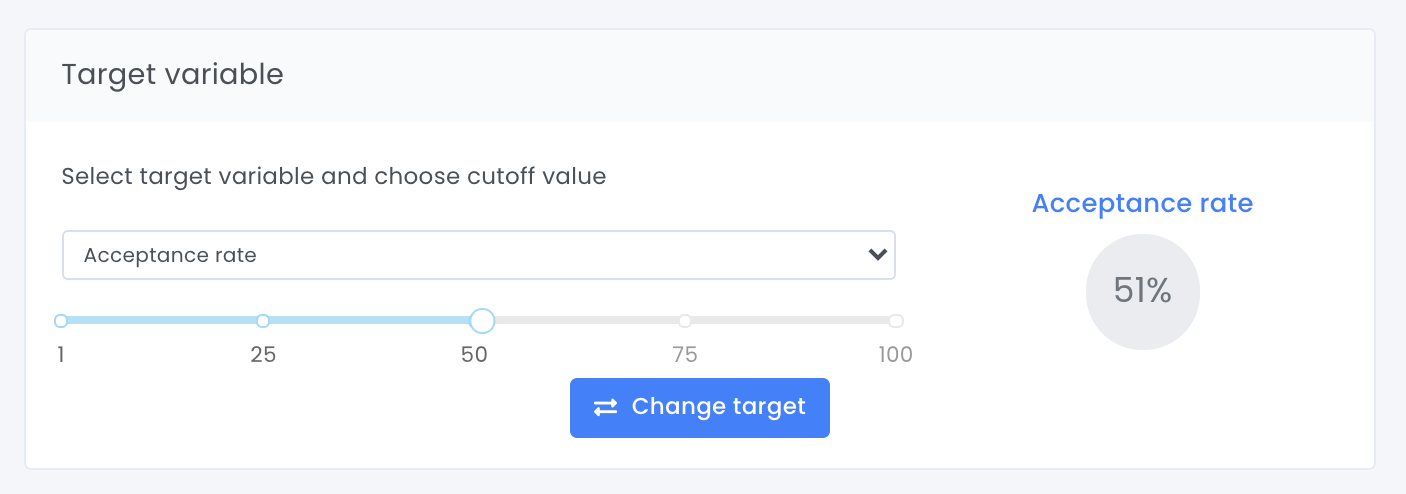
The user can then choose to optimize to one of the following target variables – Return on Equity (ROE), Return on risk adjusted to capital (RORAC), Bad rate, Profit per loan, Acceptance rate, Volume rate.
Risk converter Statistics
In the risk converter Statistics view, a user can switch target value and/or switch target variable and new statistics will be shown.

Economic impact
In section Economic impact the user can see the following KPI:s: acceptance rate, volume rate, Return on risk-adjusted capital, Bad rate, Return on equity, and profit per loan.

Population analysis
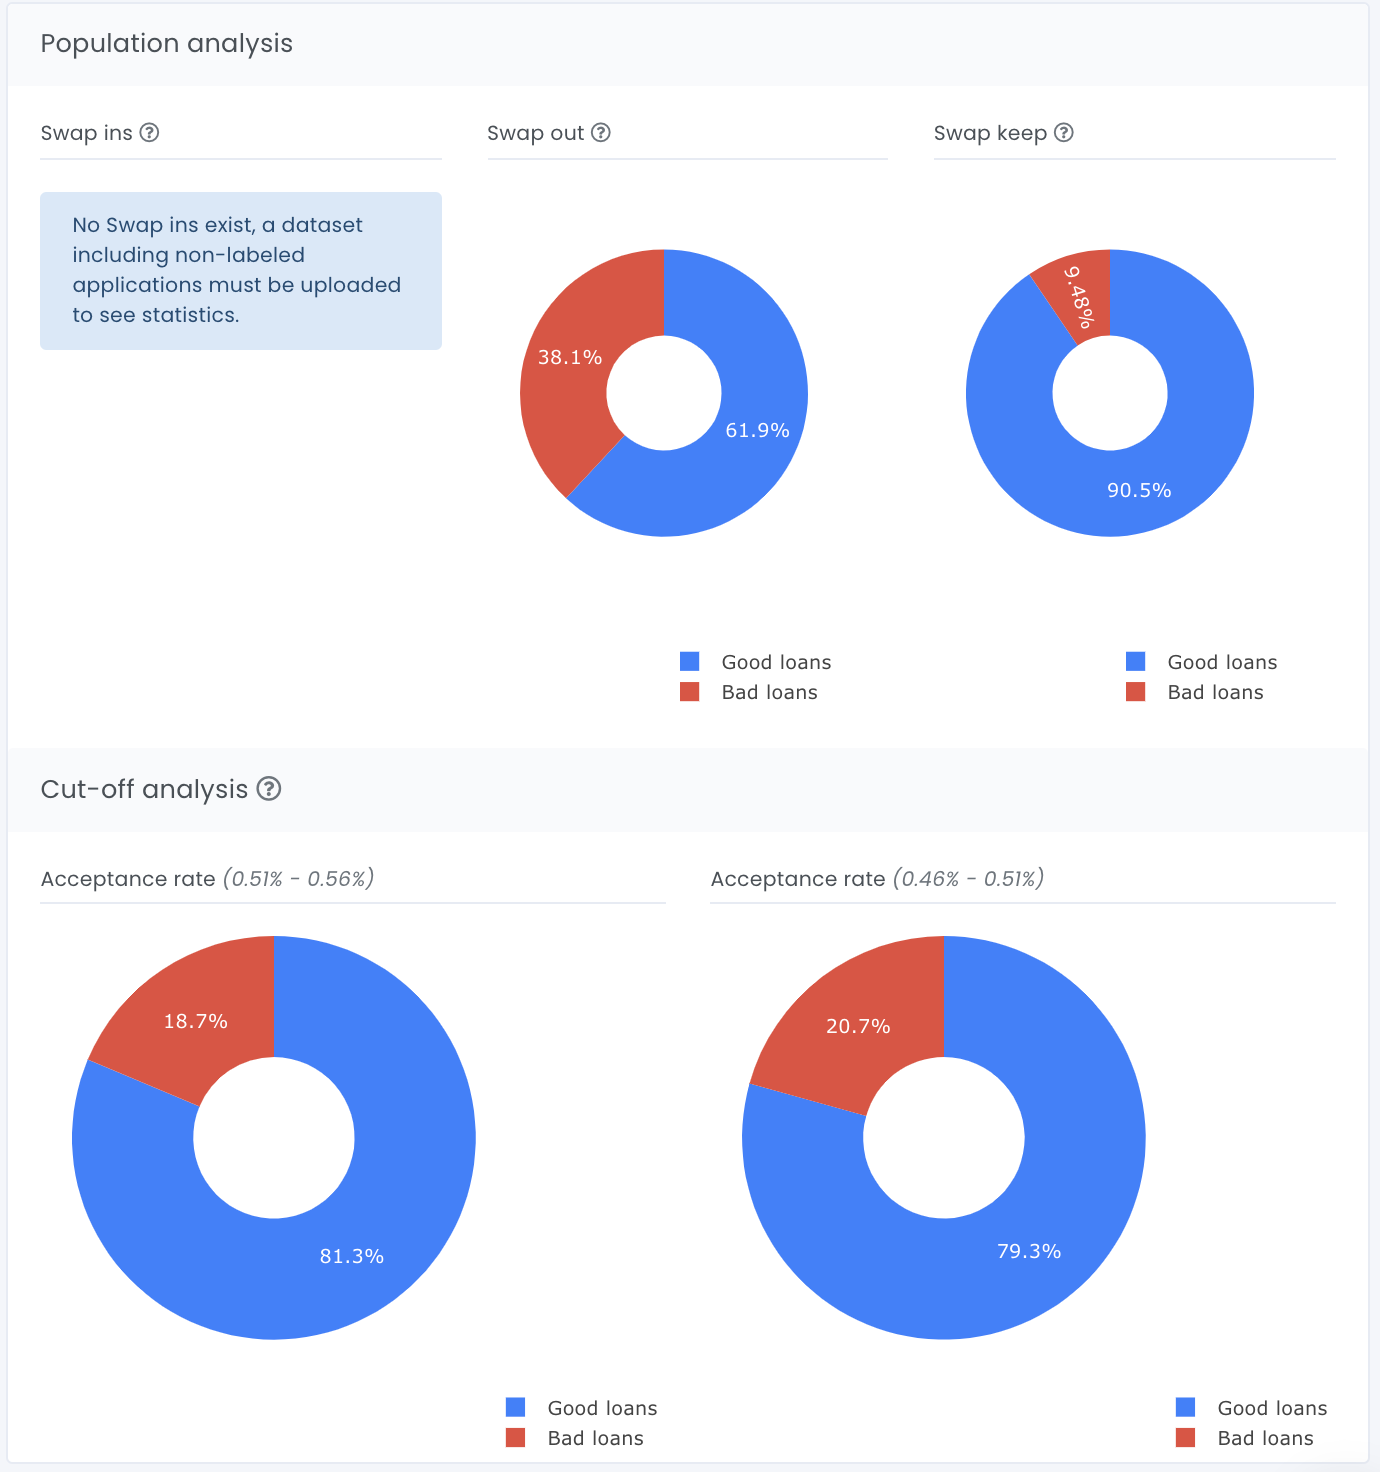
In section population analysis the user can see the statistics about:

Interest intervals
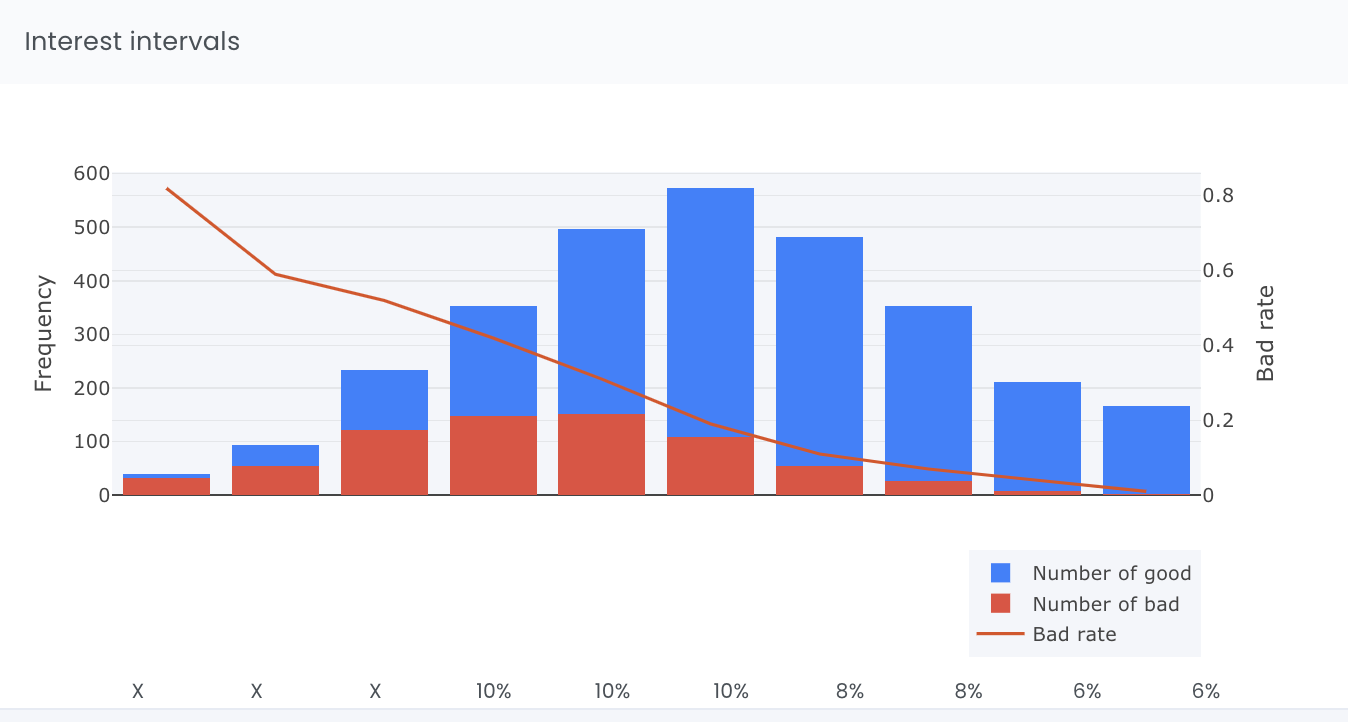
In this section a plot shows the number of applications in each score interval. The Y-axis represents the number of loan applications and the X-axis represents evispot scores. Blue colour represents non-defaulted loans and red colour represents defaulted loans. The red line shows you the default rate per score interval.

Company
© Evispot 2022 All rights reserved.

